* * HELP & MANUAL PREMIUM PACK 3 DEMO VERSION * *
This documentation was styled with a demo skin from the Premium Pack 3 add-on for Help & Manual. The contents of the skin are encrypted and not configurable.
This version is copyright and may only be used for local testing purposes. It may not be distributed.
Please purchase the full version of the Premium Pack to get the configurable skins and remove this notice.
In der Version 2.1 wurde eine neue voll funktionsfähige Aktiendiagramm Steuerelement eingeführt.
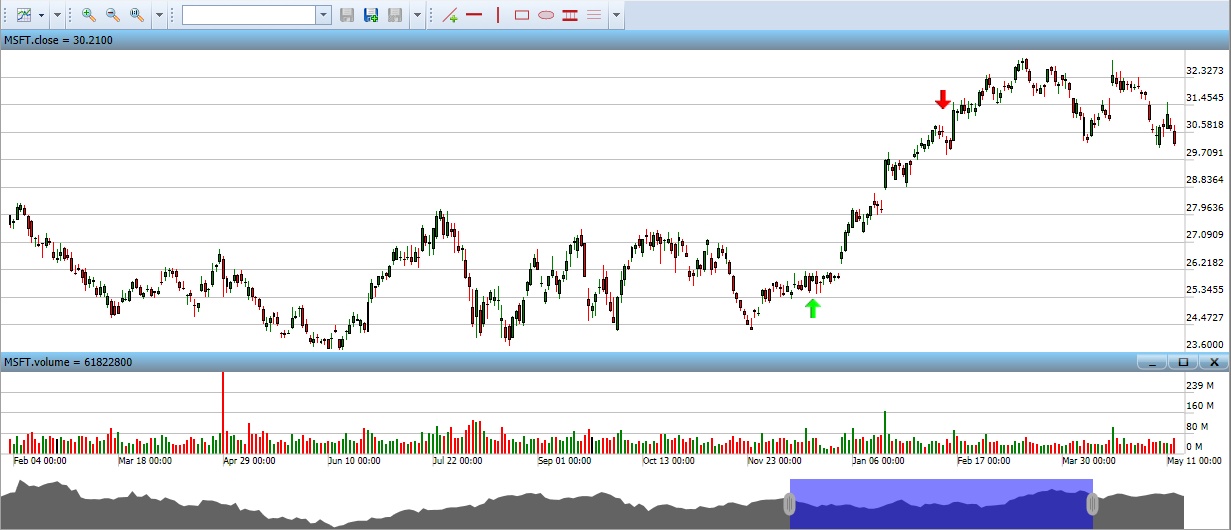
TradingDiary Pro Diagramm unterstützt mehr als hundert Indikatoren, Zoom und Zeichnungen.
Diese Ansicht besteht aus 2 getrennten Teilen. Das erste ist ein Werkzeugskasten, wo Sie das Sehen und fühlen verändern, neue Indikatoren hinzufgen, Vorlagen speichern oder laden und Linien, Rechtecken, Fibonacci Rückführung usw. zeichnen können.
Der zweite Teil ist die Diagramm-Steuerung selbst.